Look out at Rockland Harbor and you may see a tanker heading up the bay to Searsport, a midwater trawler coming in with a load of herring, or the cement tug and barge heading south.
Thanks to a federal ocean planning initiative, those interested in the maritime world can do more than speculate about these vessels.
The Northeast Ocean Data Portal—http://www.northeastoceandata.org—and the Mid Atlantic Ocean Data Portal—http://midatlanticocean.org/data-portal/—aggregate and display an unprecedented amount of information and kinds of data about where these kinds of vessels are generally found in the Gulf of Maine, or where various species of whales, birds, fish, and other creatures are found.
Some particularly interesting and representative maps include:
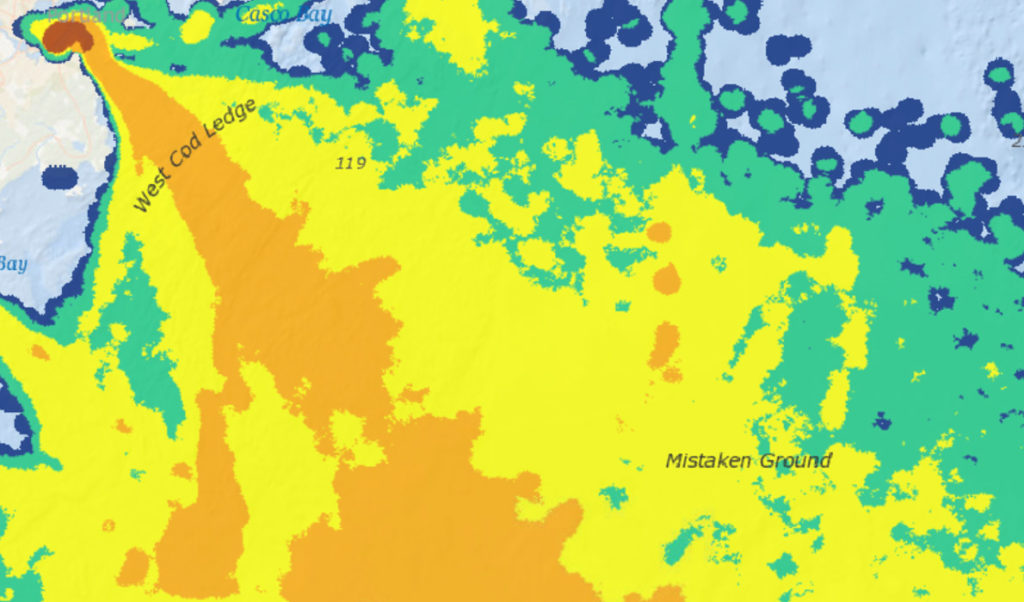
- Commercial Fishing Vessel Activity: Herring 2011-2014 <4 knots: http://www.northeastoceandata.org/9YMRvXO5. This map shows where herring vessels are traveling at less than 4 knots, which is a reasonable indication the vessels are fishing for herring. You can see hotspots of activity off the Maine coast. In a typical summer, fresh herring from these areas is an important source of lobster bait.
- Commercial Fishing Activity: Bottom Trawling <65 feet 2011-2013 from the Mid Atlantic Ocean Data portal shows very different information and sorts some of the commercial fishing data by gear type and shoreside community: http://bit.ly/2wnv95Y. If you click on a green or yellow area, you can see some of the ports fishing in those areas.
- Marine Transportation: 2012 Tanker traffic: northeastoceandata.org/e9HUI4mI and 2012 Tug and Barge Traffic at northeastoceandata.org/Lvk35DjR both show where these different kinds of vessels typically go once they port. You can see the offshore routes these vessels typically take to port.
- Baleen whales (such as the right whale, fin, humpback, and minke)—northeastoceandata.org/6teGwMf5—shows modeled abundance of different species of whales. Some whales, like right whales, are sensitive to low frequency sound, which is generated by sonar or marine construction related activity, and this map groups species vulnerable to low frequency sound: northeastoceandata.org/LV0XaILw
- Total biomass of forage species: northeastoceandata.org/q9kJSJ70 and the total biomass of species managed in the Northeast Multispecies Fishery (also known as groundfish)—northeastoceandata.org/data-explorer/?fish—are maps based on the results of Northeast Fishery Science Center trawl survey.
These maps are starting to inform federal agency decision-making. The data portal and its layers make up an important part of the Northeast Regional Ocean Plan (neoceanplanning.org/plan/), a document that provides important context about New England’s coastal communities, ocean uses, and ocean resources. The plan also commits federal agencies to use this information in regulatory or permitting decisions.
For example, the plan commits federal agencies to use the commercial fishing data layers when reviewing proposals for offshore wind turbines and scientific surveys involving research vessel activities. Federal agencies also are committed to identifying and notifying stakeholders who could be affected by offshore wind, LNG, and submarine cable projects. The data is primarily aimed at informing the early part of the regulatory process.
The plan also recommends that energy project developers use the portal as an information source. The plan recognizes that some coastal communities have a particular relationship with a specific ocean location and encourages developers to gather information about the potential cumulative impacts to that community. Ideally, this would be done before a permit application is filed.
In July, The Working Waterfront reported that Maine lobstering accounted for 270,000 fishing trips and that the value of lobsters landed in Rockland, Vinalhaven, and Stongington almost equals the combined commercial fisheries in New Hampshire, Rhode Island, and Connecticut.
The data used to create the maps is not collected for the lobster industry, so there is neither a spatial footprint for the fishery nor information to tie specific fishing areas to coastal communities. Filling these data gaps is not easy and requires careful attention to the cost vs. benefit of additional data collection.
If the plan has a flaw, it is that it lacks information explaining the role specific areas play in the operation of a fishing business. Contextual information about the management of the fishery, the social functioning of the fishery, and recent changes in the fishery could explain as much as a map. If the goal is to help federal agencies and developers make decisions that better account for our coastal communities, we need a mix of all three kinds of data.
The plan recognizes the three kinds of data as important considerations in decision making and that filling these data gaps is important to coastal communities. Acknowledging these gaps provides a placeholder for fishermen and others to raise these issues that should be considered in the context of specific projects. In the meantime, the data portal serves a useful tool for better understanding what is happening in the waters of New England.
Nick Battista is marine programs director for the Island Institute, publisher of The Working Waterfront.
What TO Read Next...