BACKGROUND
The ocean is inextricably tied to the economy, culture, and life of Maine’s coastal communities. The economy of many of these communities is now highly reliant on the lobster industry. Conflicts between the fishing industry and other ocean uses have always been a part of life, but as some existing ocean uses are expanding into new areas or growing in new ways, we are also increasingly starting to understand the contours of these conflicts. We are learning that some of them may be preventable or at the least the impacts can be mitigated. We are also seeing new ocean uses arise, such as offshore wind, being proposed for coastal waters around New England.
Managers and regulators of these uses as well as project developers, industry proponents, and those opposed to certain activities can all be better informed about the importance of ocean space to the fishing industry. This knowledge can lead to more informed decisions which will account for the potential impact on the fishing industry and the coastal communities that depend on these waters.
In New England, the Northeast Ocean Plan and the ocean planning process produced two different ways of providing useful contextual information about the fishing industry. Additionally, the Mid-Atlantic process used one separate method. Taken together, these three different ways of describing where commercial fishing activity happens on the water help provide a deep understanding of our fishing industries. This background context about specific fisheries helps make sure decision-makers are aware of the connection between the fishing industry and coastal communities. This understanding is critical to avoiding significant unintended consequences of decisions. Each method of describing the fishing industry gives voice to fishermen and fishing communities in different ways, and the inclusion of all three methods in the decision-making process helps ensure significant issues are not overlooked.
ESTABLISHING A SPATIAL FOOTPRINT
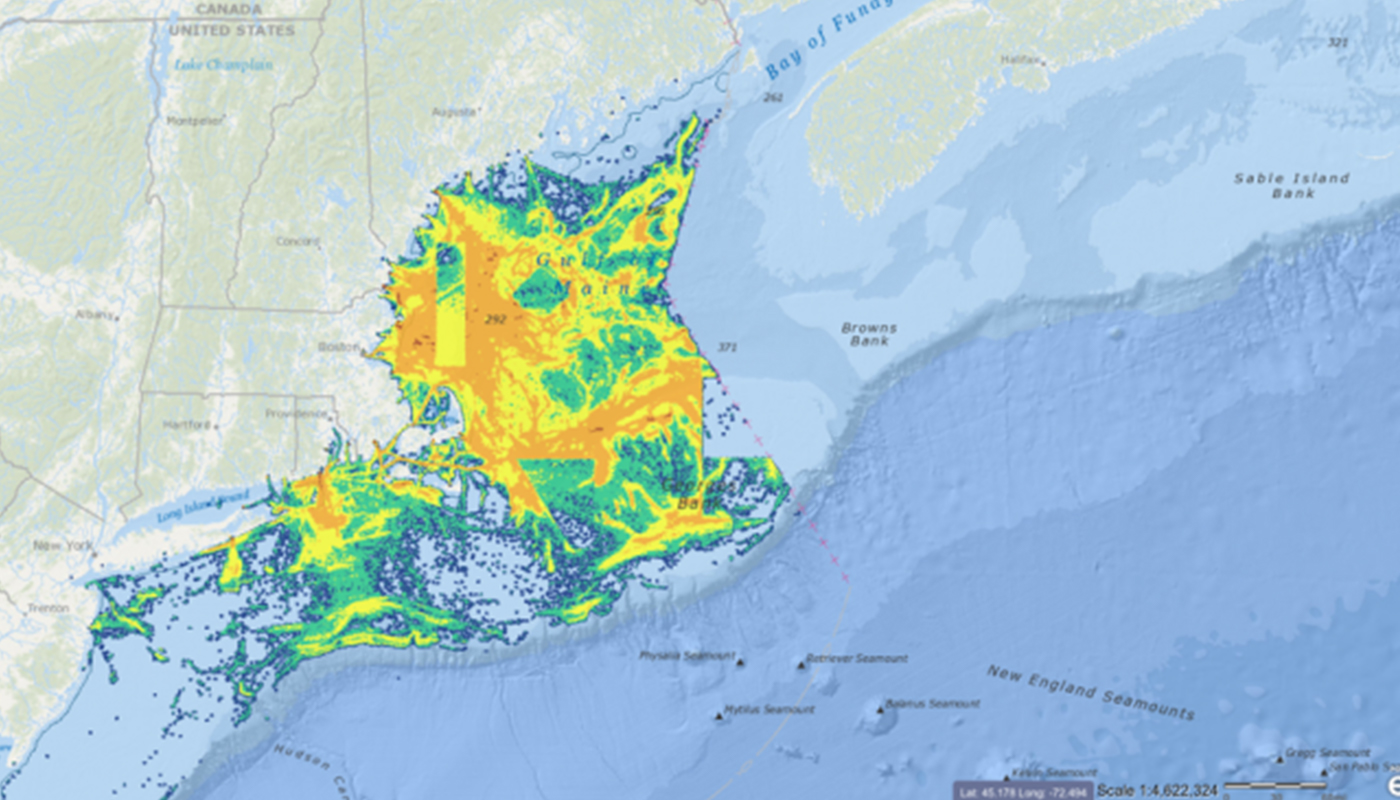
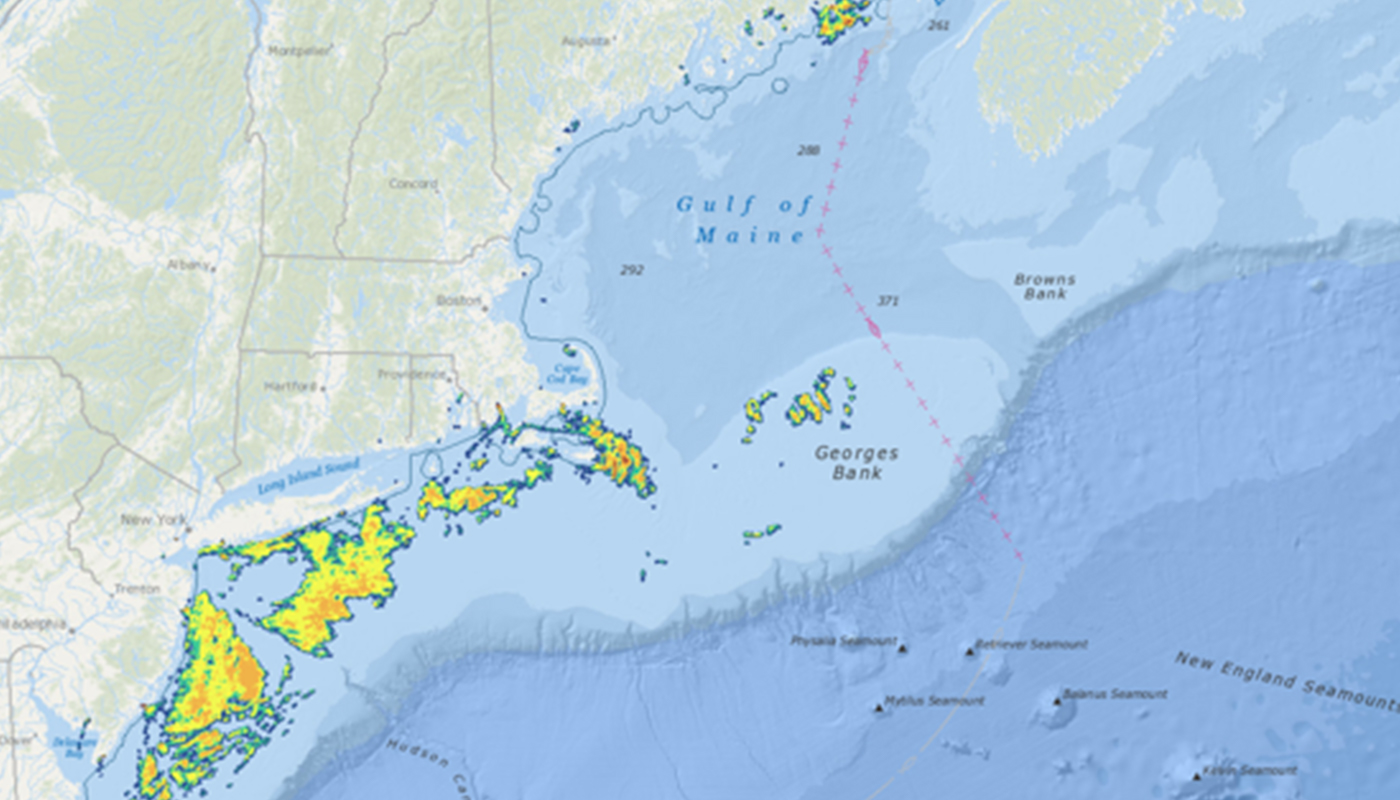
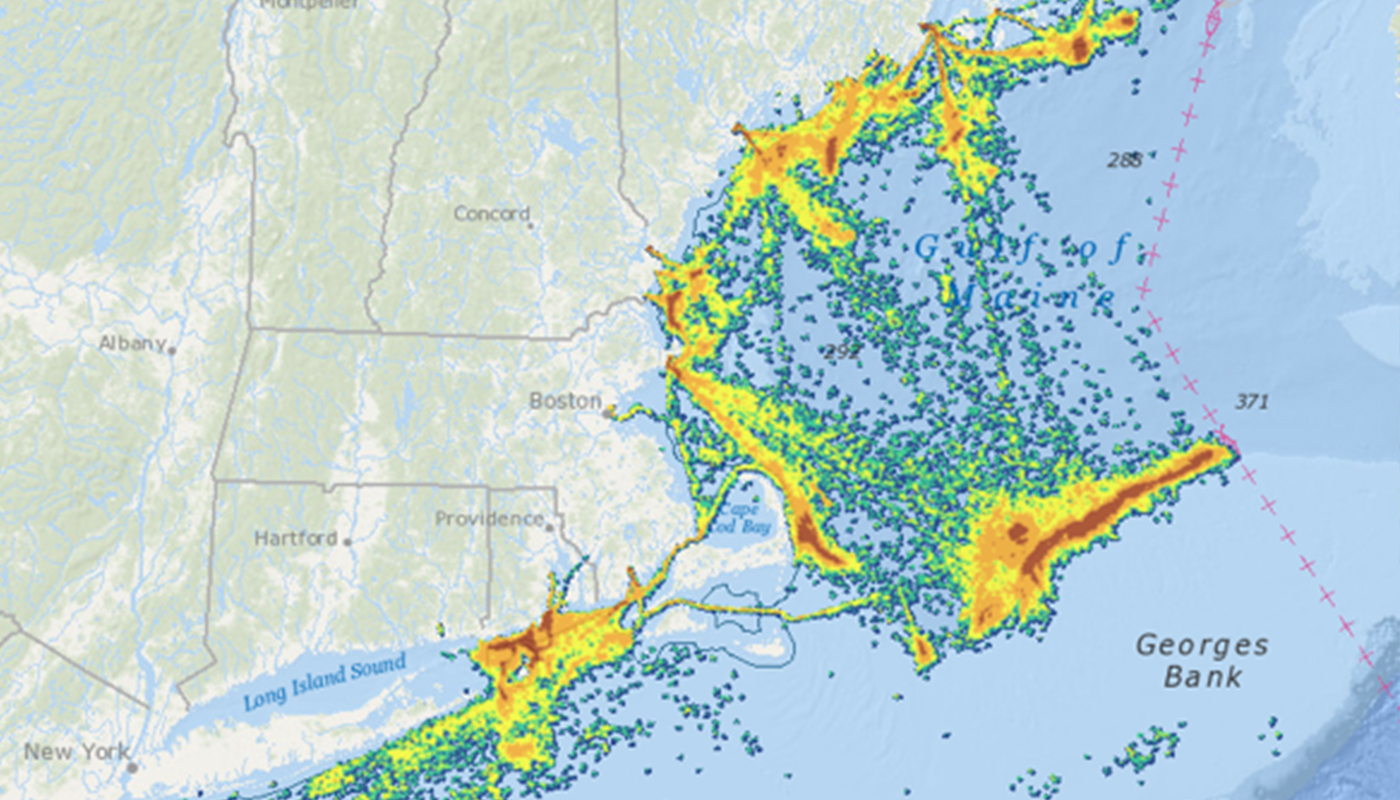
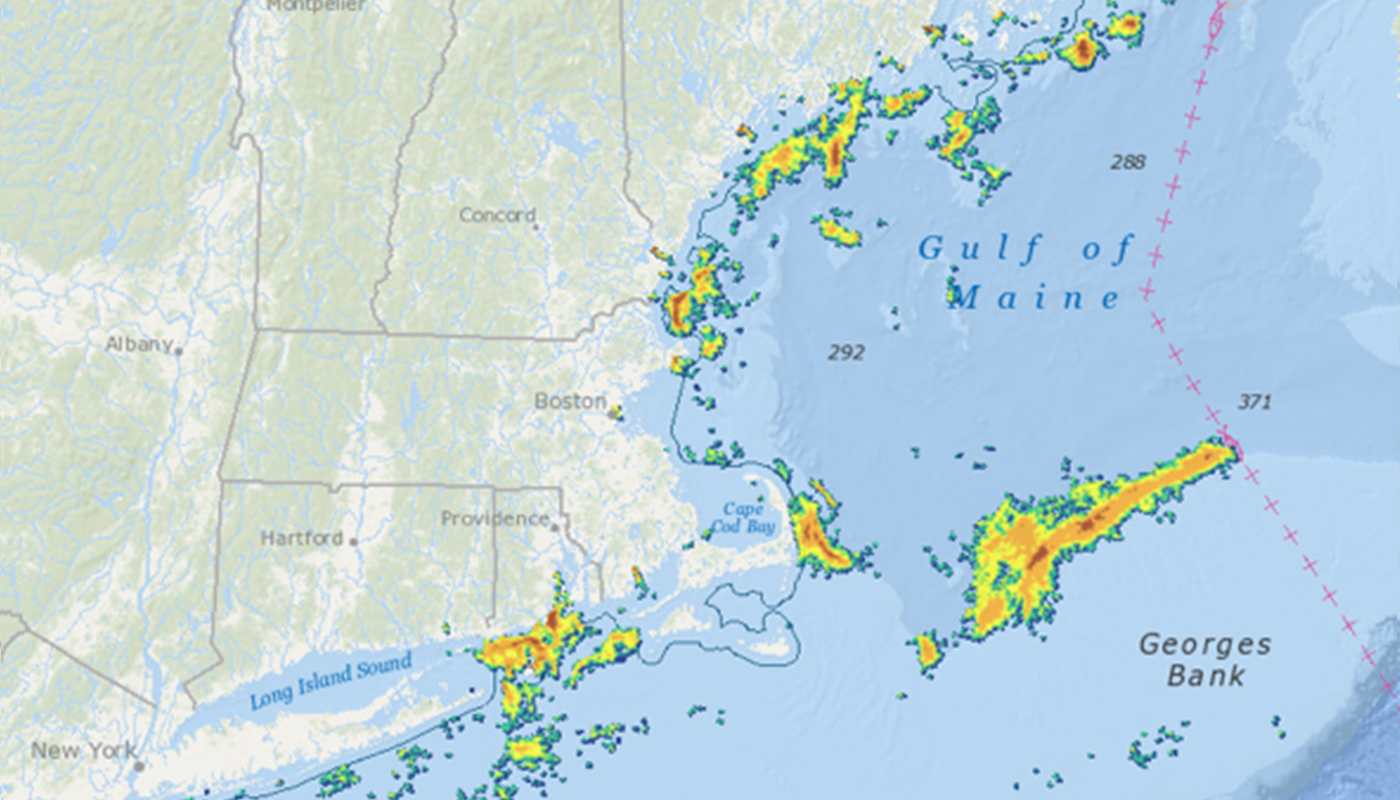
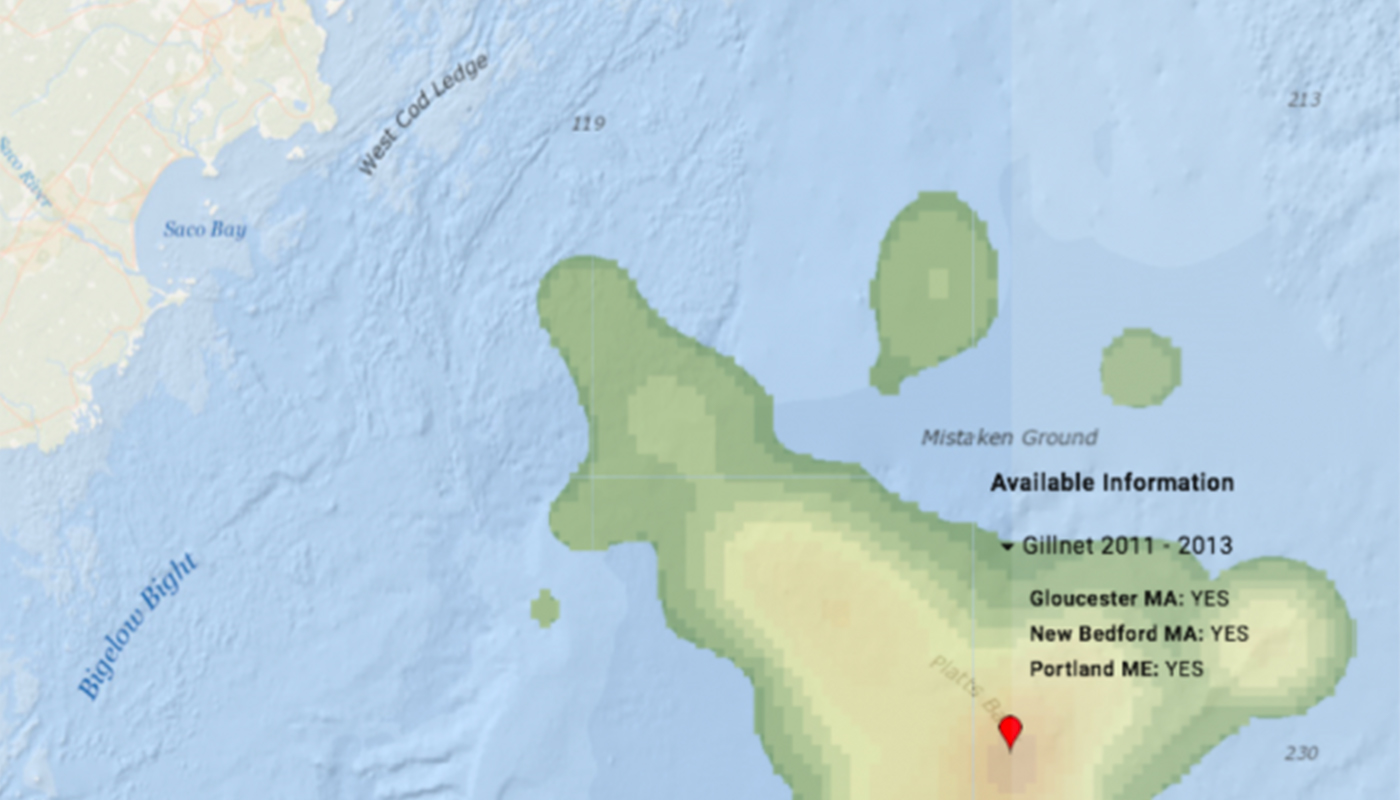
The Northeast Regional Ocean Council (NROC) is accumulating a variety of data layers which include relative densities of marine life and economically significant ocean areas. Much of this data was collected using location data collected by Vessel Monitoring Systems (VMS) aboard fishing boats that participate in some federally managed fisheries. The data was aggregated to include all of the vessels in that fishery, and maps were created to show the “hot” and “cold” spots of commercial fishing vessel activity. The “hot” spots were areas with a lot of pings, and the “colder” locations were areas with fewer pings.
Through an iterative process of meeting with industry members and refining draft products, NROC was able to develop spatial footprints for 6 fisheries. These maps are accurate representations of the spatial footprint of these fisheries and very helpful for determining whether a specific fishery has used a specific part of the ocean in the last few years. Fishermen were very concerned that the absence of data or the absence of a significant amount of fishing activity would lead uninformed users of the maps to determine that the fishing industry cared less about a particular spot.
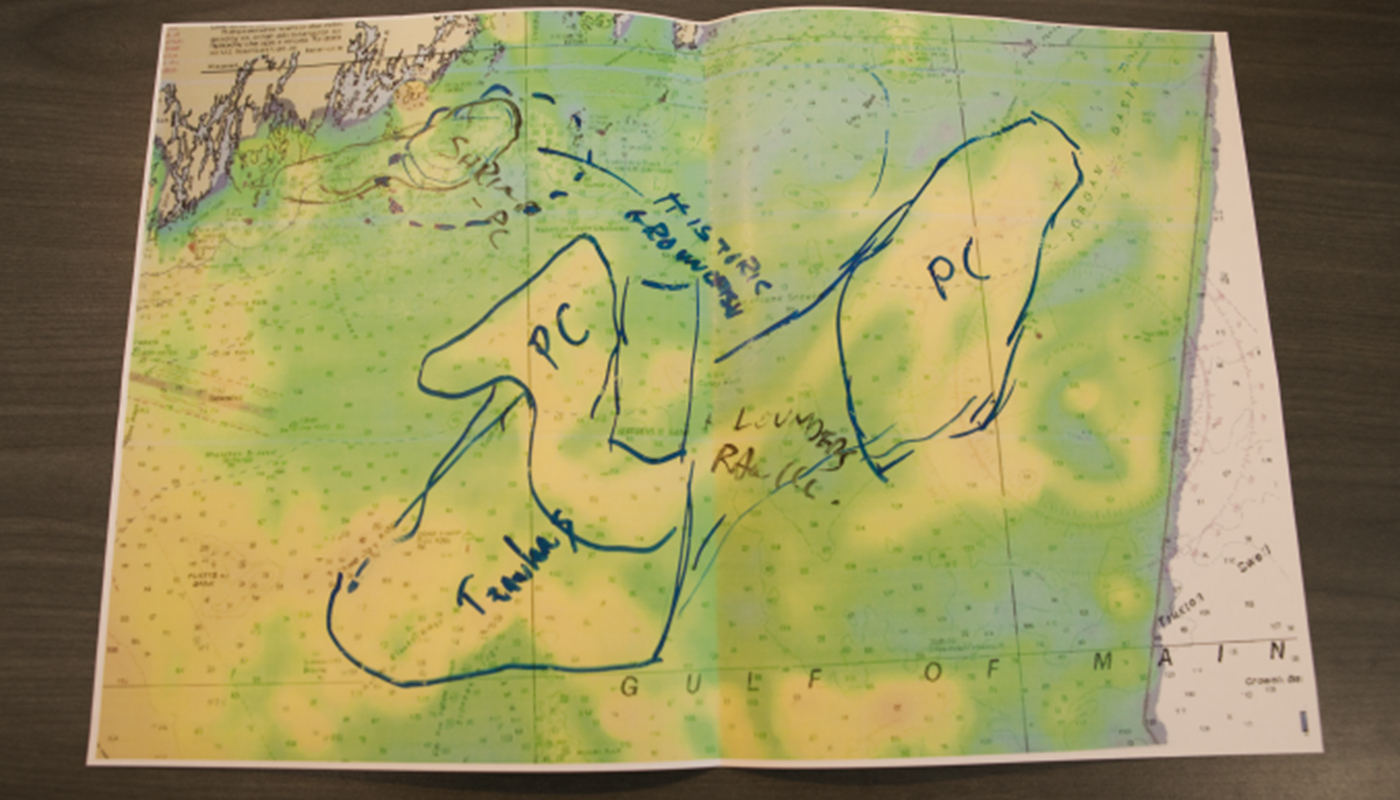
Throughout the process, fishermen had significant concerns about the misinterpretation of the maps and NROC posted the maps with a set of caveats that are intended to limit the use of the maps or at least allow anybody to point out why a certain interpretation isn’t correct.
Some of the major concerns included –
- Implicit assumptions could be made that “cold” areas are of lower importance to fishermen when in fact fishermen identified areas of lower activity that were seasonally important to the entire fishery or critical to a subset of fishermen – either a particular gear type or specific fishing community. These areas showed up as “cold” because they are closed to fishing activity due to management concerns, but they could be opened up again.
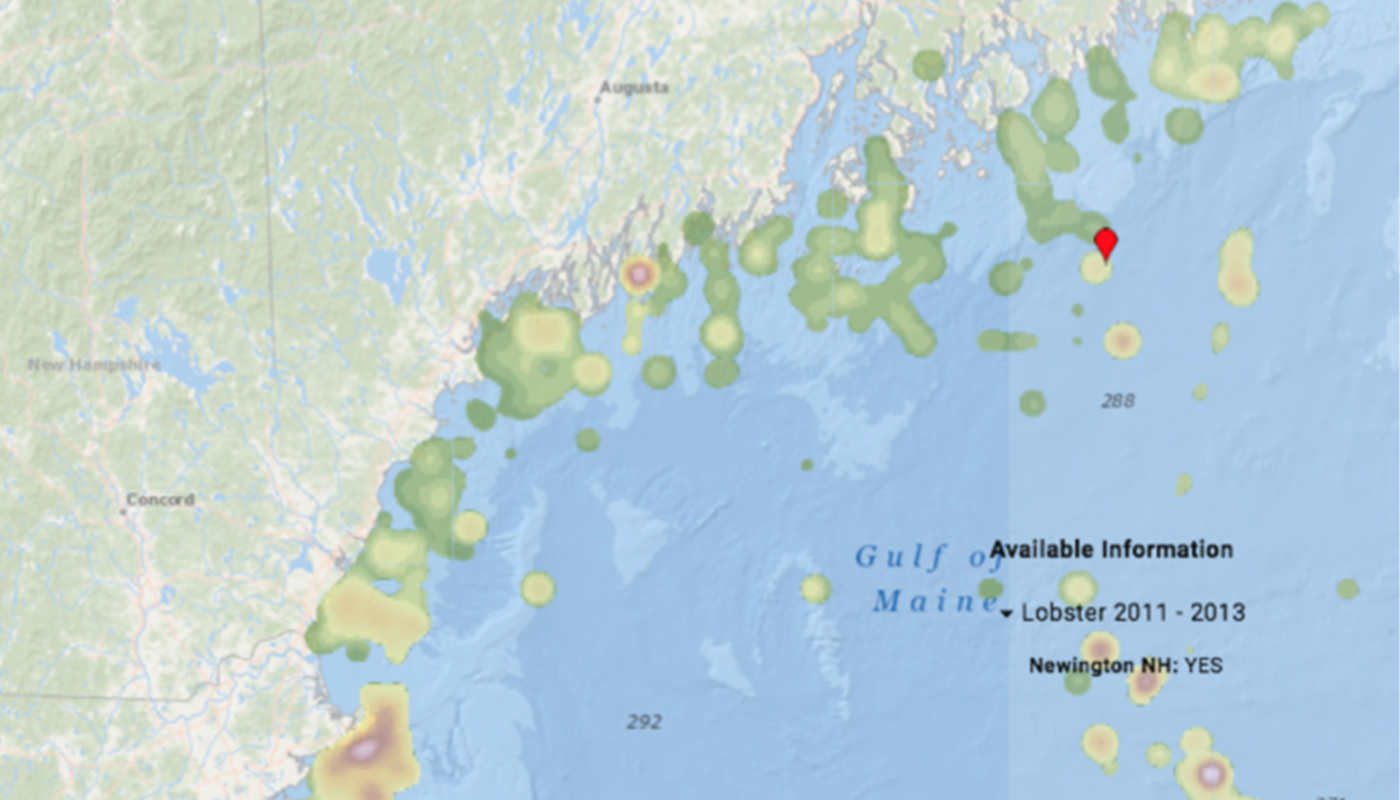
- Vessels that are not fishing in the Northeast Multispecies/Groundfish, (i.e. fisheries other than: monkfish, scallop, herring, Squid/Mackerel/Butterfish, or surf clam/ocean quahog fisheries) are not required to have VMS on board and are left out of these data sets. Regionally important fisheries such as lobster, tuna, and the party charter fishery all lack this sort of spatial footprint.
- Beyond identifying that a specific fishery might have an interest in a particular area, the spatial footprint is not particularly helpful in describing which fishermen are working there or which communities might have an interest in that particular space, why an area is important, how fishermen use it, and how that use has changed or might change with a shifting environment.
IDENTIFYING COMMUNITY INTEREST IN OCEAN SPACE
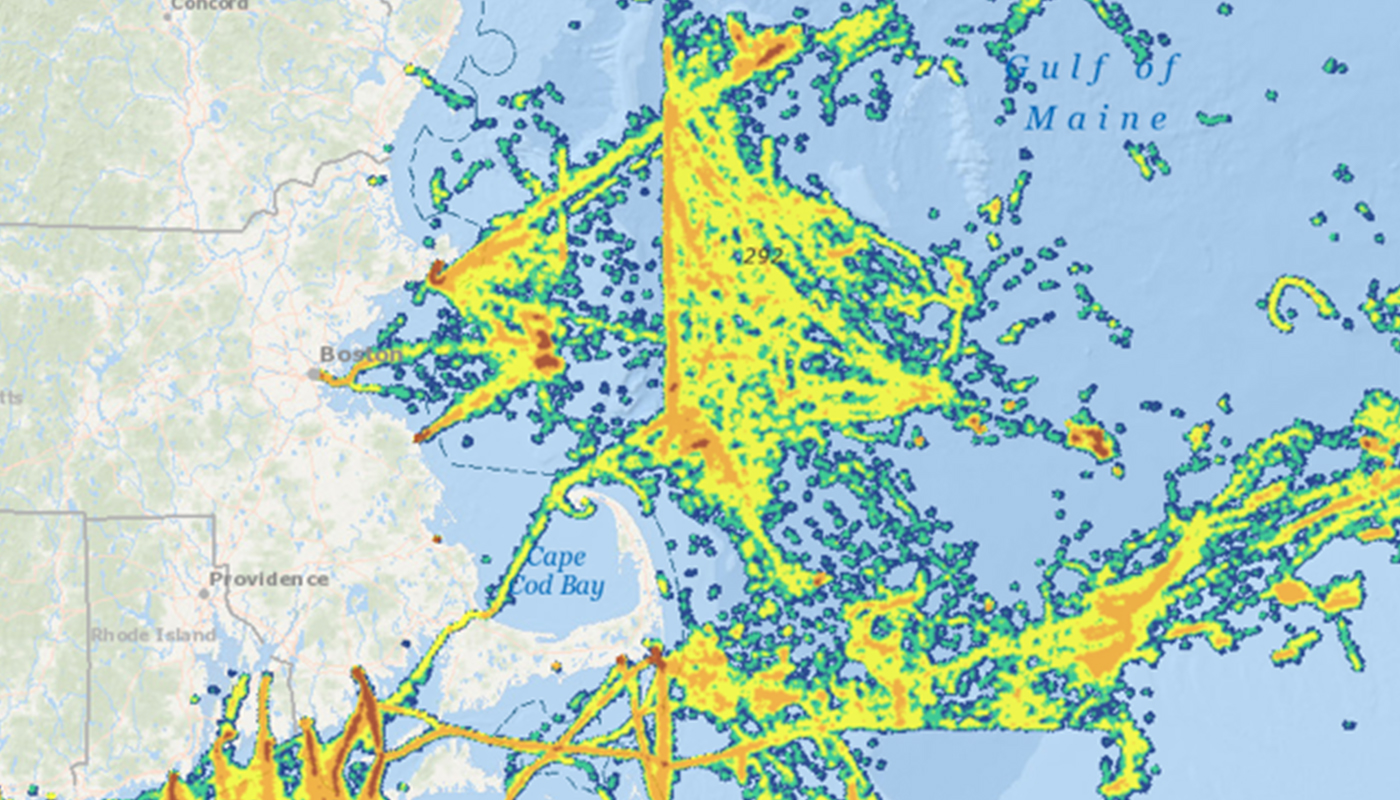
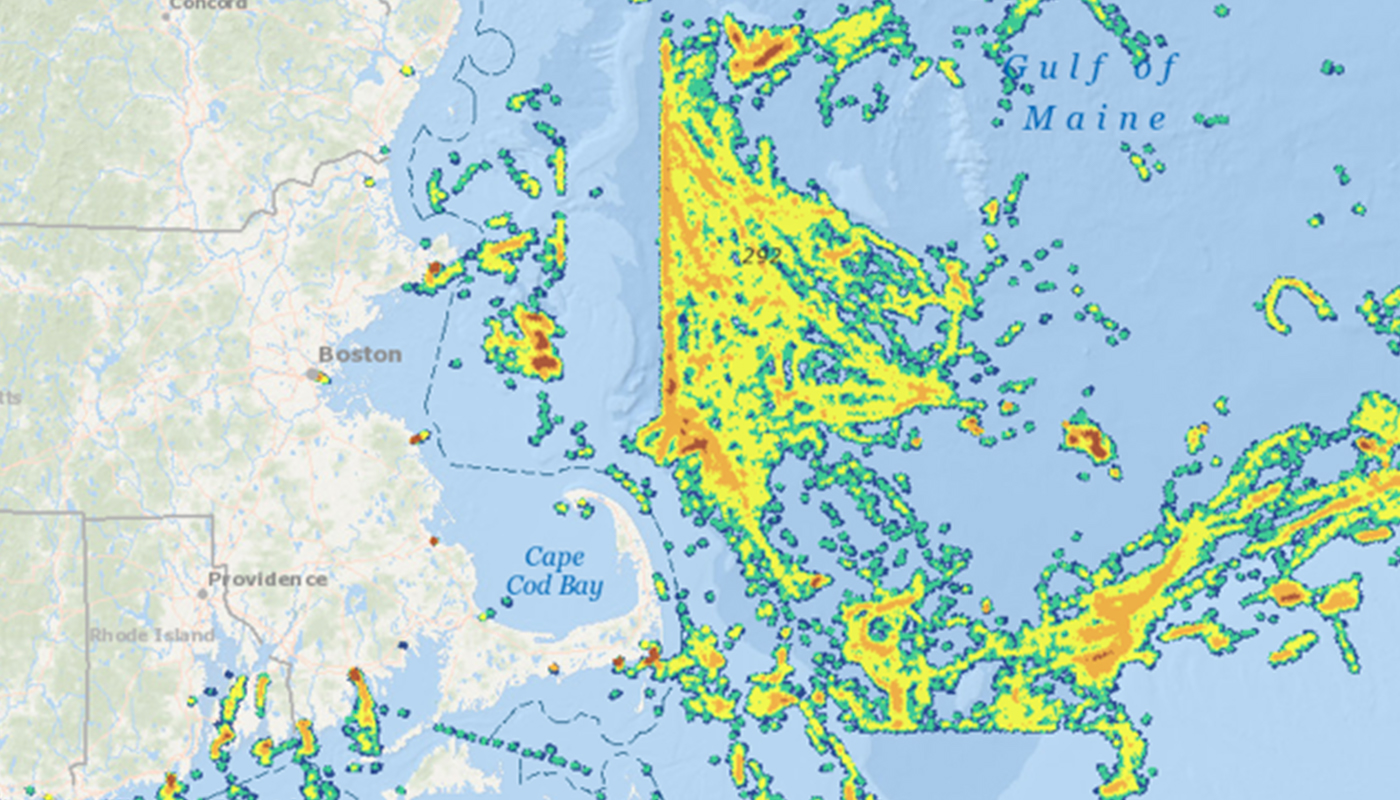
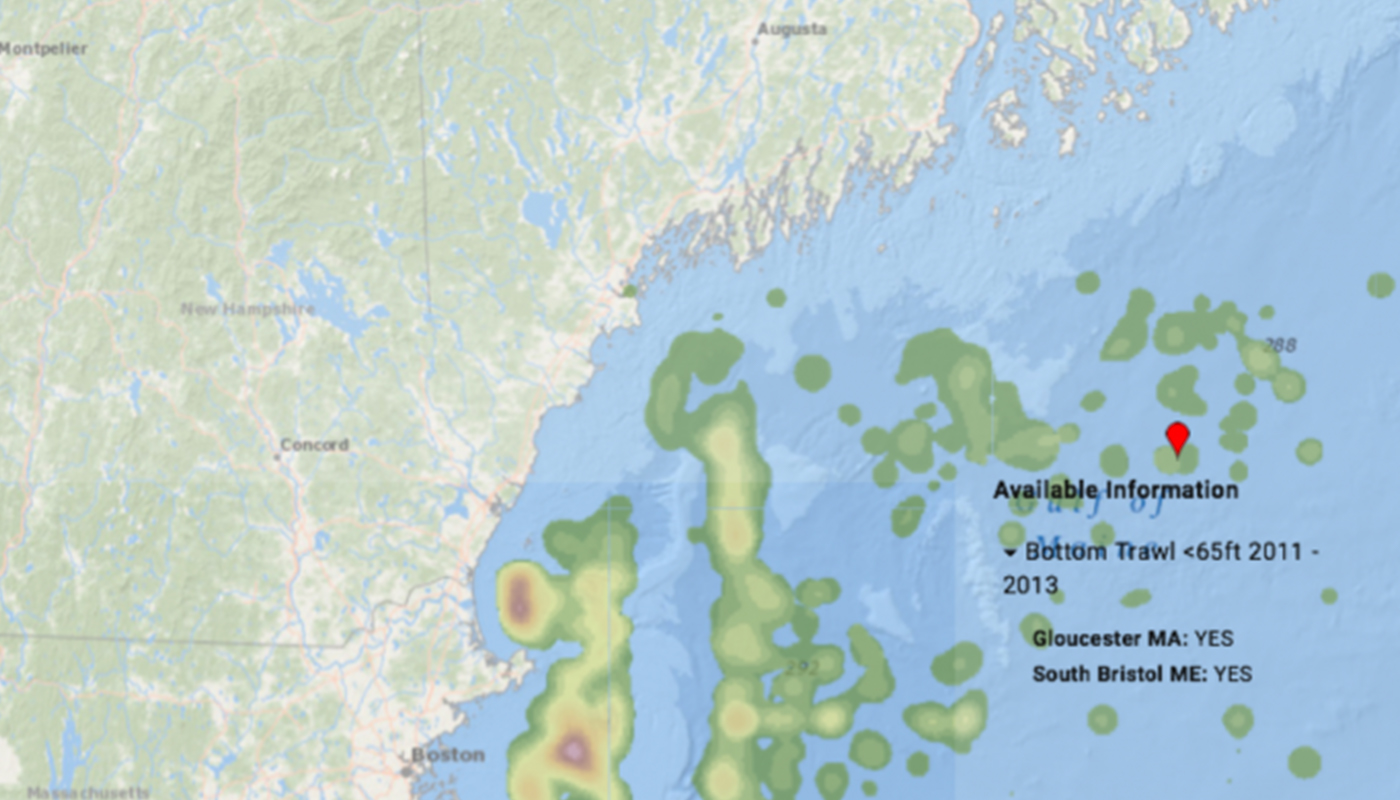
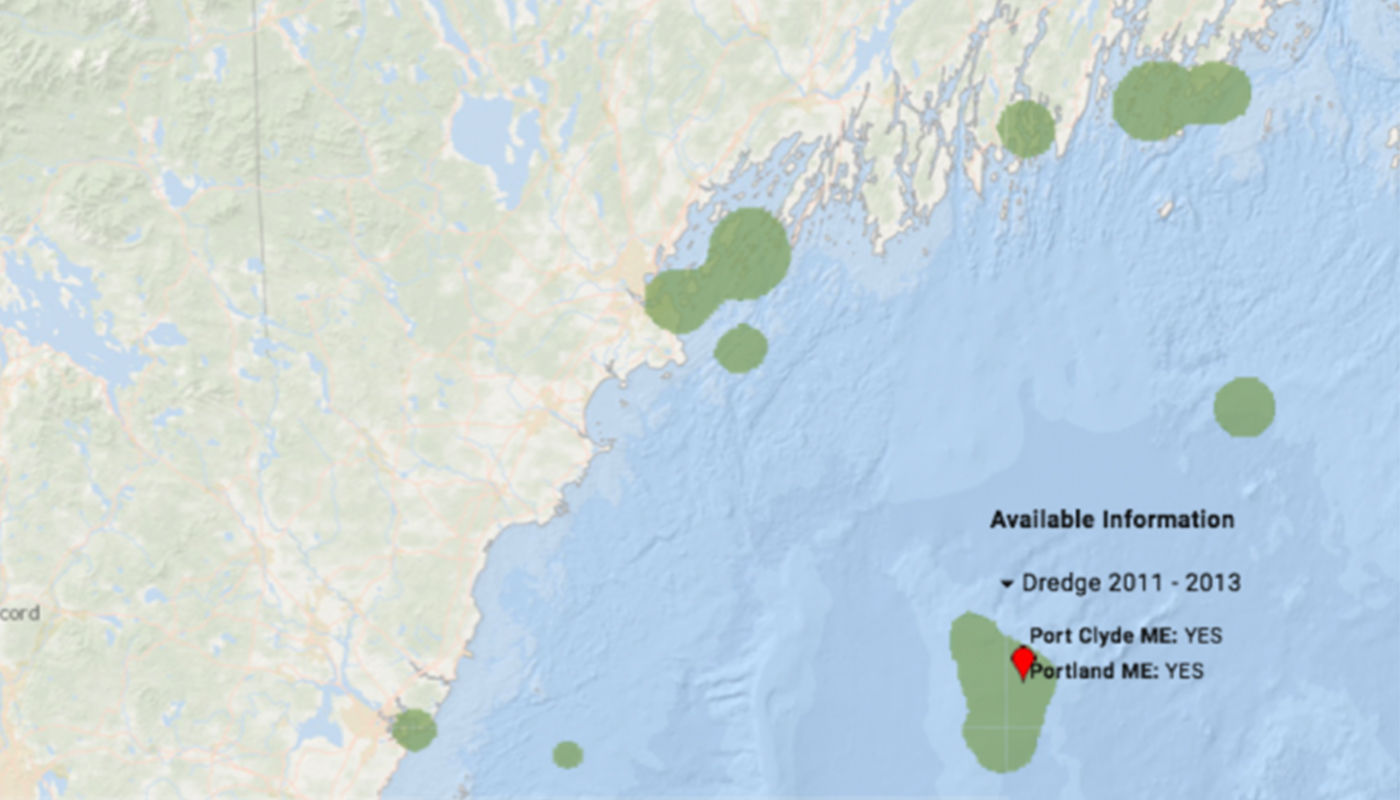
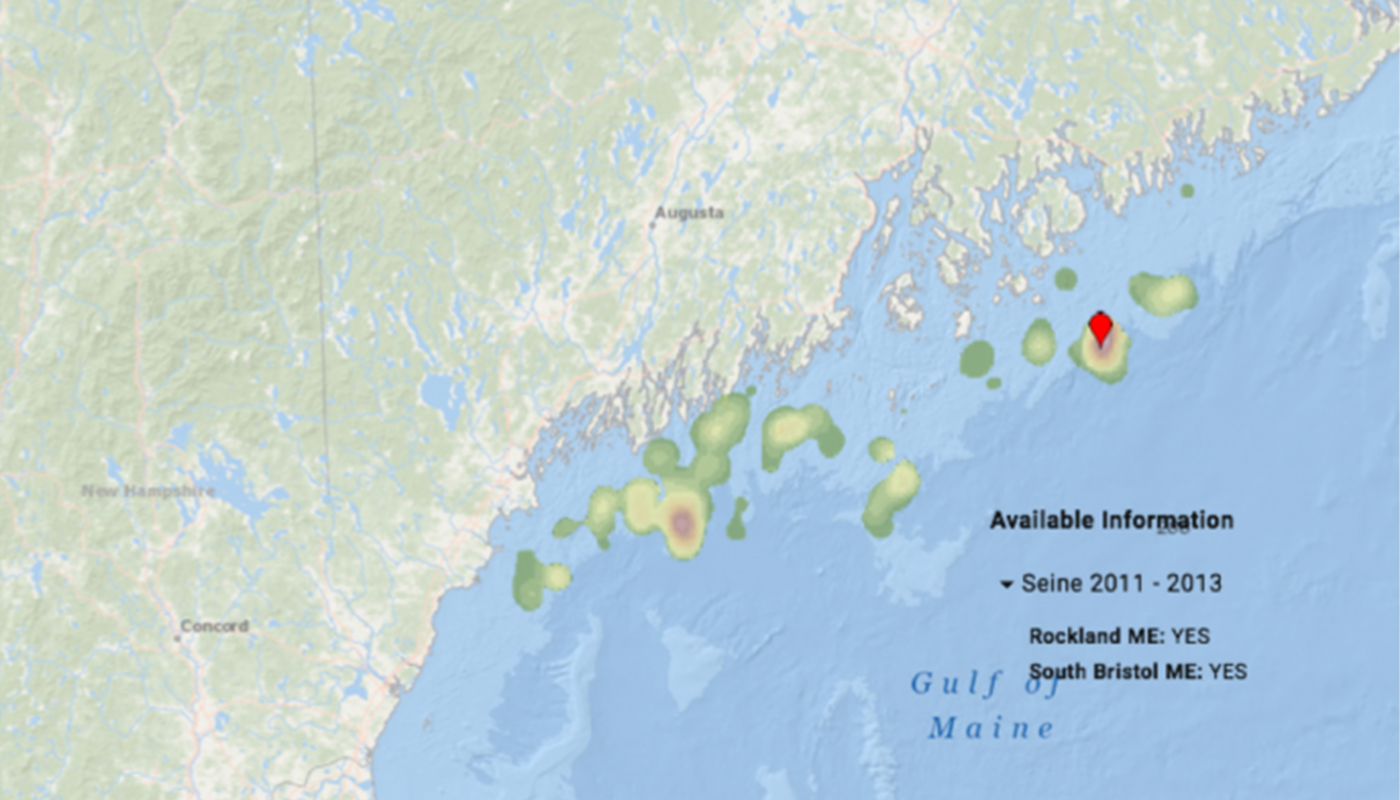
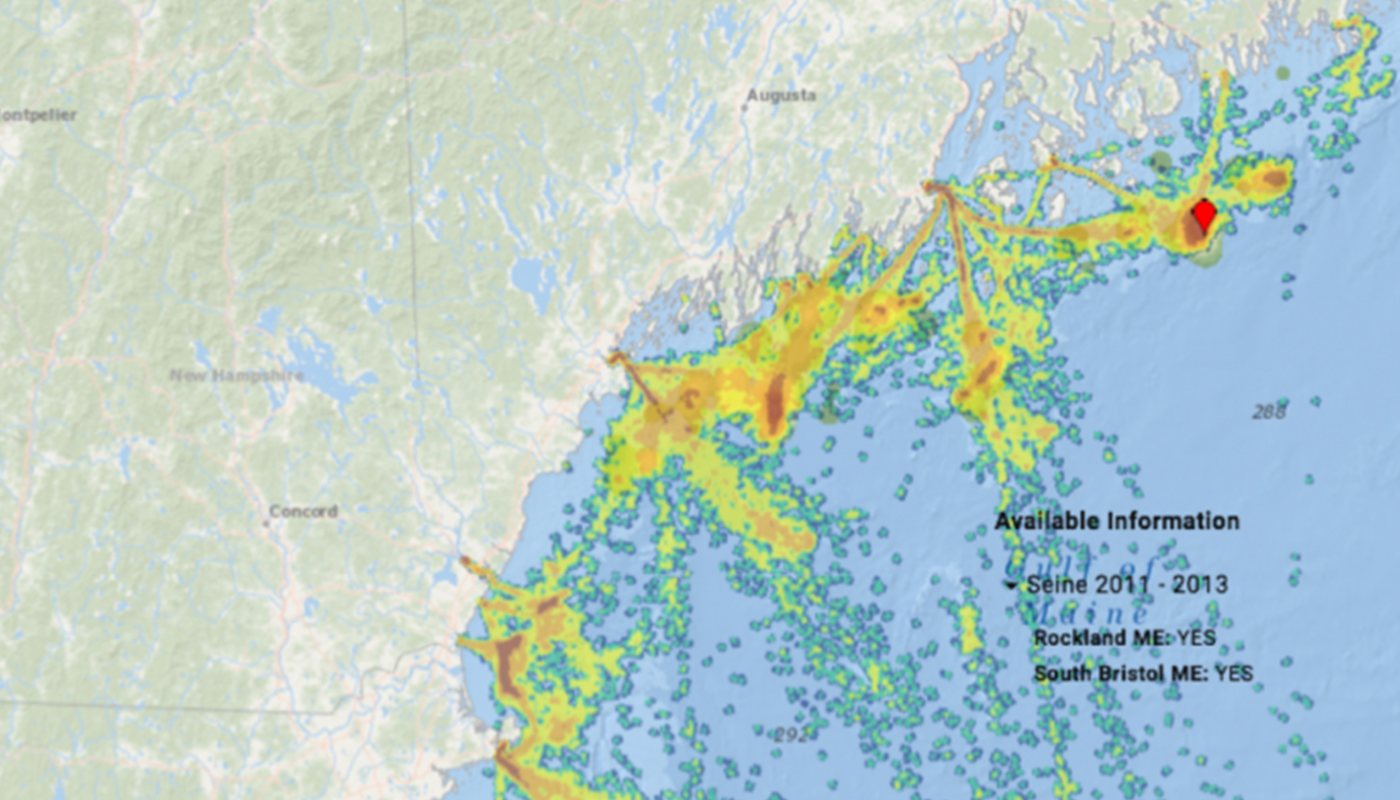
The Mid-Atlantic Regional Ocean Council is also creating maps of where various ocean uses appear. With data about commercial fisheries, the MARCO took a different and highly complementary approach. MARCO used Vessel Trip Report (VTR) data to connect areas of the ocean back to specific shore side communities. VTR’s are filled out by each fisherman engaged in federally managed fisheries and they include a variety of information such as the vessel, the captain, the gear used, the types and pounds of different species caught, where the fish were caught, and where the catch was offloaded. MARCO linked the VTR’s to specific fishing permits and to the “principle port” for those vessels. The resulting maps show areas where there is a “community presence” by gear type.
These types of maps are helpful for identifying shore-side communities that might have an interest in a specific location and therefore helpful for identifying where outreach activities related to ocean planning should be focused. Because the maps are broken down by gear type instead of fishery, they can be helpful in identifying the sort of conflict that might occur between fishing and other ocean uses. Different gear types have different kinds of conflicts – it may be very easy for a fisherman who uses mobile gear, like a bottom trawler to avoid a hydrographic survey vessel while a fishermen fishing with fixed gear may have more concerns. Similarly, an underwater cable may not be an issue for a seiner but could prevent a scallop dredge from being used in an area.
While MARCO used a different data set and processed the data in a different way, the approach to working with the industry was similar, and they also developed a similar list of caveats. Notably, these caveats include
- These maps represent a fixed moment in time and fishing activity shifts over time due to a variety of factors – including market dynamics, regulatory changes, and fishing strategies.
- The maps only show vessels that have federal fishing permits and do not show boats that are solely engaged in state waters fisheries.
- Maps of fixed gear activity tend to be more accurate than those of mobile gear and maps showing day trips tend to be more accurate than multiday trips. Typically, this means that the maps of fixed gear close to shore are more accurate than mobile gear offshore.
- VMS maps provide additional precision for some fisheries, but there is general agreement between the two data when one is laid on top of the other.
- For some types of decision making, (e.g. detailed construction plans for energy infrastructure) much finer scale information and data will be needed. Fine scale data cannot be obtained using either VTR or VMS data and will ideally be provided by fishermen.
It is important to note that one of the final caveats for the maps is that “Fisheries and fisheries data are complex and there are many options for mapping fishing activity, each with strengths and weaknesses. These maps are intended as a starting point to help target and guide direct engagement and consultation with specific affected fishing communities during diverse ocean planning, permitting and management decision making processes.”
ADDITIONAL RESOURCES
- Northeast Regional Ocean Plan
- Northeast Ocean Data Portal
- Fisheries Characterization I
- Fisheries Characterization II
- Mid-Atlantic Ocean Portal
- Commercial Fisheries Maps
- Creating a Place for “Community” in New England Fisheries
- Video: Using the Northeast Ocean Plan
Originally Published November 2017
